Using candlestick patterns for analysis, traders delve into the intricate world of financial markets, decoding the secrets hidden within these powerful patterns. From the history of candlestick patterns to their practical implications in technical analysis, this guide offers a comprehensive exploration of this essential tool for market interpretation.
As we uncover the nuances of common candlestick patterns, interpret their implications, and delve into advanced analysis techniques, you will gain a deeper understanding of how to leverage these patterns for informed decision-making in trading.
Introduction to Candlestick Patterns

Candlestick patterns have a rich history dating back to 17th century Japan when they were used to analyze the price of rice contracts. Today, these patterns are a popular tool in technical analysis for predicting future price movements in financial markets.
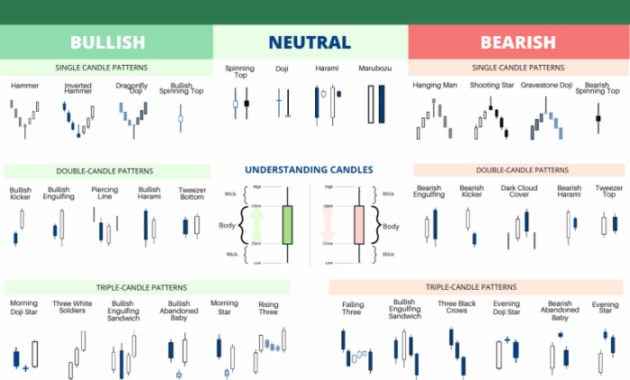
The basic elements of a candlestick include the body, wick, and color. The body represents the opening and closing prices of a specific time period, while the wick (or shadow) shows the high and low prices during that period. The color of the candlestick, usually green or red, indicates whether the price closed higher or lower than it opened.
Significance of Candlestick Patterns in Technical Analysis
- Candlestick patterns provide valuable insights into market sentiment and potential price reversals.
- They help traders identify key levels of support and resistance, as well as trend reversals.
- Patterns like doji, hammer, and engulfing can signal potential entry or exit points for trades.
- Understanding candlestick patterns can enhance trading strategies and improve decision-making in volatile markets.
Common Candlestick Patterns

Candlestick patterns are crucial tools for analyzing price movements in financial markets. Understanding popular patterns like Doji, Hammer, Engulfing, and Harami can provide valuable insights into market sentiment and potential future price action.
Doji
A Doji candlestick pattern is characterized by its open and close prices being very close or equal, resulting in a small or non-existent body. This pattern suggests indecision in the market, with neither buyers nor sellers taking control. A Doji can signal potential reversals or continuation of trends, depending on its position within the price chart.
Hammer
The Hammer pattern is a bullish reversal signal that appears at the bottom of a downtrend. It has a small body at the top and a long lower wick, resembling a hammer. This pattern indicates that sellers were initially in control but were overcome by buyers, potentially leading to a trend reversal to the upside.
Engulfing
An Engulfing pattern consists of two candlesticks where the body of the second candle completely engulfs the body of the first candle. A bullish Engulfing pattern occurs after a downtrend and suggests a potential reversal to the upside, while a bearish Engulfing pattern after an uptrend signals a possible downturn.
Harami, Using candlestick patterns for analysis
The Harami pattern involves two candlesticks where the second candle’s body is contained within the body of the first candle. A bullish Harami occurs after a downtrend and may indicate a reversal to the upside, while a bearish Harami after an uptrend suggests a potential reversal to the downside.
These popular candlestick patterns provide valuable insights into market sentiment and potential price movements. By recognizing and interpreting these patterns on price charts, traders and investors can make more informed decisions based on the signals they provide.
Interpreting Candlestick Patterns
Candlestick patterns are powerful tools that traders use to analyze market movements and predict potential price reversals or continuations. Understanding how to interpret these patterns can provide valuable insights into market sentiment and potential future price action.
Single Candlestick Patterns vs. Multiple Candlestick Patterns
Single candlestick patterns, such as doji, hammer, or shooting star, can provide valuable information on their own. However, the reliability of these patterns increases when they are confirmed by multiple candlestick patterns forming consecutively. Traders often look for patterns like engulfing, harami, or evening star to strengthen their analysis and increase the probability of accurate predictions.
Volume and Trend Confirmation
In addition to analyzing candlestick patterns, traders also consider volume and trend confirmation to enhance the reliability of their interpretations. High trading volume accompanying a specific candlestick pattern can provide validation of the pattern’s significance. Moreover, confirming the pattern within the context of the overall market trend can increase the likelihood of a successful trade. By combining volume and trend analysis with candlestick patterns, traders can make more informed decisions and improve their trading strategies.
Advanced Candlestick Analysis Techniques: Using Candlestick Patterns For Analysis

Candlestick patterns can be powerful tools for analyzing market trends and making trading decisions. However, to enhance the effectiveness of candlestick analysis, traders often combine these patterns with other technical indicators. By integrating multiple tools, traders can gain a more comprehensive understanding of market dynamics and improve the accuracy of their predictions.
Combining Candlestick Patterns with Technical Indicators
- One common approach is to use moving averages in conjunction with candlestick patterns. Moving averages can help confirm the signals provided by candlestick patterns and filter out noise in the price data.
- Another popular combination is using oscillators like the Relative Strength Index (RSI) or Stochastic Oscillator alongside candlestick patterns. Oscillators can provide additional confirmation of price momentum and potential reversal points indicated by candlestick patterns.
- Volume indicators are also frequently used in combination with candlestick analysis. High trading volume can validate the significance of a candlestick pattern, indicating strong market participation and increasing the reliability of the signal.
Confirmation Signals and Filters
- Confirmation signals are additional indicators or patterns that traders look for to validate the signals generated by candlestick patterns. These signals can help reduce false alarms and increase the accuracy of trading decisions.
- Filters are criteria that traders use to determine which signals to act upon and which ones to ignore. By applying filters based on market conditions, risk tolerance, or other factors, traders can improve the quality of their trades and avoid unnecessary losses.
Creating a Trading Strategy Based on Candlestick Patterns
- Step 1: Identify key candlestick patterns that have proven to be reliable indicators in the past.
- Step 2: Combine these patterns with complementary technical indicators to confirm signals and filter out false alarms.
- Step 3: Establish clear entry and exit rules based on the combined analysis of candlestick patterns and other indicators.
- Step 4: Implement risk management measures to control potential losses and protect profits.
Final Summary
By mastering the art of candlestick pattern analysis, traders can unlock valuable insights into market trends, enhancing their ability to make strategic and profitable trading decisions. Dive into the world of candlestick patterns today and elevate your trading game to new heights of success.
When it comes to trading in the Forex market, understanding how to interpret Forex news is crucial for making informed decisions. By keeping up with the latest news and economic indicators, traders can gain valuable insights into market trends and potential opportunities.
To learn more about how to interpret Forex news effectively, check out this comprehensive guide on How to interpret Forex news.
When it comes to trading in the Forex market, understanding how to interpret Forex news is crucial for success. By staying up-to-date on economic indicators, central bank announcements, and geopolitical events, traders can make informed decisions. It’s important to analyze the impact of news on currency pairs and adjust your strategies accordingly.
For a comprehensive guide on how to interpret Forex news effectively, check out this How to interpret Forex news resource.