How to analyze stock charts: In this comprehensive guide, we delve into the world of stock chart analysis, unraveling the mysteries behind different chart types, analysis methods, and pattern interpretations. Get ready to sharpen your trading skills and make informed decisions in the stock market.
Understanding the nuances of stock charts is essential for any investor or trader looking to navigate the complexities of the financial markets.
Understanding Stock Charts

When it comes to analyzing stocks, understanding stock charts is essential. Stock charts provide a visual representation of a stock’s price movement over a specific period, helping investors make informed decisions based on historical data.
Types of Stock Charts
- Line Charts: Line charts connect the closing prices of a stock over a period, providing a simple visualization of price trends.
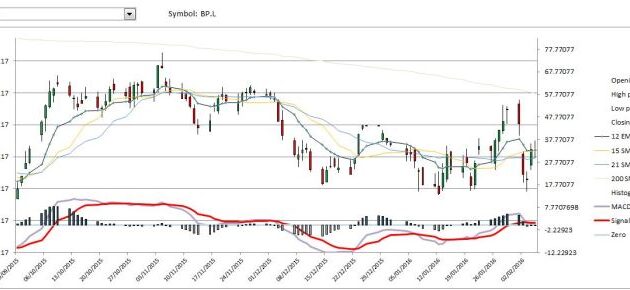
- Candlestick Charts: Candlestick charts display the open, high, low, and close prices of a stock within a specific time frame, offering more detailed information.
- Bar Charts: Bar charts show the range between the high and low prices, along with the opening and closing prices, in a vertical bar format.
Significance of Stock Charts
Stock charts play a crucial role in evaluating price movements by highlighting trends, patterns, and potential support and resistance levels. They help investors identify entry and exit points, assess market sentiment, and predict future price movements based on historical data.
Key Elements in a Stock Chart
- Trendlines: Trendlines connect consecutive lows or highs to identify the direction of the trend.
- Support and Resistance Levels: These levels indicate where a stock’s price may find difficulty moving beyond or bouncing back from.
- Volume: Volume bars on a stock chart show the amount of trading activity, helping investors gauge market interest in a particular stock.
- Moving Averages: Moving averages smooth out price data over a specific period, providing insights into the stock’s overall trend.
Types of Stock Analysis
When it comes to analyzing stocks, there are two main approaches that investors use: technical analysis and fundamental analysis. Both methods have their own set of tools and strategies for evaluating the potential of a stock.
Technical Analysis
Technical analysis is a method of evaluating securities by analyzing statistics generated by market activity, such as historical prices and volume. This approach relies heavily on stock charts to identify patterns and trends that can help predict future price movements. Technical analysts believe that historical price data can provide valuable insights into the psychology of the market and can help them make informed decisions about when to buy or sell a stock.
- Technical analysts use various tools, such as moving averages, support and resistance levels, and chart patterns, to analyze stock charts and identify potential entry and exit points.
- They also look for indicators, such as the Relative Strength Index (RSI) or Moving Average Convergence Divergence (MACD), to confirm their analysis and make well-informed trading decisions.
- Technical analysis is more focused on short-term price movements and is often used by traders looking to capitalize on market volatility.
Fundamental Analysis
Fundamental analysis, on the other hand, involves evaluating a company’s financial health and performance to determine its intrinsic value. While fundamental analysis does not rely heavily on stock charts, it can complement technical analysis by providing a deeper understanding of the company behind the stock.
- Fundamental analysts examine factors such as earnings, revenue, growth potential, industry trends, and management quality to assess the value of a stock.
- They look at financial statements, economic indicators, and market data to make informed investment decisions based on the underlying value of a company.
- Fundamental analysis is more suited for long-term investors who are interested in the overall health and growth potential of a company rather than short-term price movements.
Interpreting Stock Chart Patterns

When analyzing stock charts, it is crucial to understand various chart patterns that can provide valuable insights into future price movements. By identifying common patterns such as head and shoulders, double tops, and triangles, investors can make more informed decisions regarding their investments.
Head and Shoulders Pattern
The head and shoulders pattern is a bearish reversal pattern that indicates a potential trend reversal from bullish to bearish. It consists of three peaks – the left shoulder, head, and right shoulder – with a neckline connecting the lows of the two troughs. A break below the neckline confirms the pattern and suggests a downward price movement.
Double Tops and Bottoms
Double tops and bottoms are reversal patterns that occur after an uptrend (double top) or downtrend (double bottom). A double top forms when prices reach a peak twice with a trough in between, indicating a potential trend reversal to the downside. Conversely, a double bottom forms when prices hit a low twice with a peak in between, signaling a possible trend reversal to the upside.
Triangles
Triangles are continuation patterns that represent a period of consolidation before the price breaks out in the direction of the prevailing trend. There are three main types of triangles – symmetrical, ascending, and descending. A symmetrical triangle shows converging trendlines, while an ascending triangle has a flat top and rising bottom trendline. In contrast, a descending triangle features a flat bottom and descending top trendline.
By interpreting these chart patterns, investors can gain valuable insights into potential price movements and make more informed trading decisions based on bullish or bearish signals. It is essential to combine chart pattern analysis with other technical indicators for a comprehensive understanding of the market dynamics.
Technical Indicators and Tools
When analyzing stock charts, technical indicators and tools play a crucial role in providing insights into potential trends and market movements. These indicators help traders and investors make informed decisions based on historical price data and market trends.
Essential Technical Indicators
- Moving Averages: Moving averages smooth out price data to identify trends over a specific period. Common types include simple moving averages (SMA) and exponential moving averages (EMA).
- Relative Strength Index (RSI): RSI measures the speed and change of price movements. It indicates whether a stock is overbought or oversold, helping traders identify potential reversal points.
- Moving Average Convergence Divergence (MACD): MACD is a trend-following momentum indicator that shows the relationship between two moving averages of a security’s price.
How Technical Tools Help in Analysis, How to analyze stock charts
Using tools like moving averages, RSI, and MACD can provide valuable insights into market dynamics. Moving averages help identify trends, while RSI and MACD help gauge momentum and potential reversal points. By analyzing these indicators, traders can make more informed decisions based on both trend and momentum signals.
Importance of Combining Multiple Indicators
- Combining multiple indicators can offer a more comprehensive view of a stock’s potential movements. Each indicator provides unique insights, and by considering multiple indicators simultaneously, traders can confirm signals and reduce false positives.
- For example, if both RSI and MACD indicate a potential uptrend, it strengthens the case for a buy signal. Conversely, conflicting signals from different indicators can signal caution and the need for further analysis.
Concluding Remarks: How To Analyze Stock Charts
:max_bytes(150000):strip_icc()/dotdash_Final_Introductio_to_Technical_Analysis_Price_Patterns_Sep_2020-02-59df8834491946bcb9588197942fabb6.jpg?w=700 "Excel stock chart market data analysis template analyse using indicators macros technical tool create templates time trading various")
Mastering the art of analyzing stock charts can provide you with valuable insights and a competitive edge in the realm of investing. By understanding the various chart patterns, technical indicators, and tools, you can make informed decisions and enhance your trading strategies. Start exploring the world of stock chart analysis today and unlock the potential for financial success.
When it comes to investing, finding the top stocks for capital appreciation is crucial for long-term growth. These stocks have the potential to increase in value over time, providing investors with a solid return on their investment. Understanding the market trends and analyzing the performance of different companies can help in identifying these top stocks.
For a detailed list of top stocks for capital appreciation, you can check out this insightful article on Top stocks for capital appreciation.
When looking for top stocks for capital appreciation, it’s essential to consider companies with strong growth potential and solid financial performance. One stock that stands out in this regard is XYZ Company, known for its consistent revenue growth and innovative product offerings.
Investors who are seeking long-term growth opportunities may find XYZ Company a promising investment. To learn more about top stocks for capital appreciation, you can check out this informative article: Top stocks for capital appreciation.