Stock analysis using moving averages sets the stage for a deep dive into the world of trend analysis, offering insights that can help investors make informed decisions in the dynamic stock market environment.
From understanding the basics to exploring advanced strategies, this comprehensive guide equips you with the knowledge needed to navigate the complexities of stock analysis with confidence.
Introduction to Moving Averages
Moving averages are a popular tool used in stock analysis to identify trends and potential trading opportunities. They smooth out price data to create a single flowing line that helps traders and investors better understand the direction of a stock’s price movement over time.
Types of Moving Averages
- Simple Moving Average (SMA): The SMA calculates the average price of a stock over a specific period, giving equal weight to each data point. It is easy to calculate and is commonly used by traders.
- Exponential Moving Average (EMA): The EMA gives more weight to recent prices, making it more responsive to short-term price changes compared to the SMA. It is favored by traders looking to react quickly to market movements.
Application of Moving Averages in Stock Analysis
Moving averages can be used in various ways to analyze stock trends, including:
- Identifying trend direction: Traders use moving averages to determine whether a stock is in an uptrend, downtrend, or range-bound.
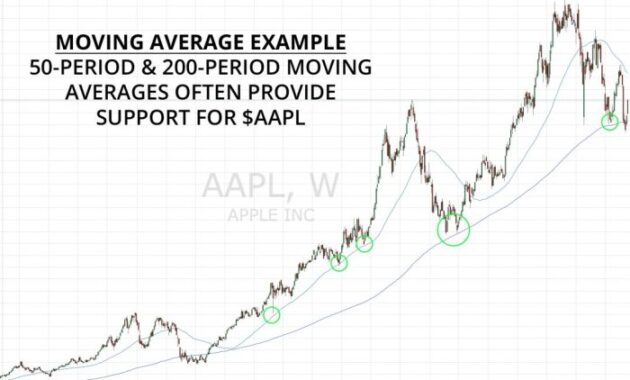
- Support and resistance levels: Moving averages can act as dynamic support or resistance levels, indicating potential buying or selling opportunities.
- Crossover signals: When a short-term moving average crosses above or below a longer-term moving average, it can signal a potential change in trend direction.
Simple Moving Average (SMA): Stock Analysis Using Moving Averages
A Simple Moving Average (SMA) is a technical analysis tool used to smooth out price data by creating a constantly updated average price. It is calculated by adding up a set number of closing prices for a specific period and then dividing that total by the number of periods.
Advantages and Disadvantages of using SMAs in stock analysis
- Advantages:
- Helps in identifying trends by smoothing out price fluctuations.
- Easy to understand and calculate, making it suitable for beginners.
- Provides a clear signal when a stock is in an uptrend or downtrend.
- Disadvantages:
- Can lag behind actual price movements, leading to delayed signals.
- Not effective in choppy or sideways markets where prices fluctuate but do not establish a clear trend.
- May generate false signals during periods of high volatility.
Step-by-step guide on how to calculate SMAs for stock analysis
- Choose a specific period for the SMA calculation (e.g., 50 days).
- Sum up the closing prices of the stock for the selected period.
- Divide the total by the number of periods to get the SMA value.
- Plot the SMA values on a chart to visualize the trend.
- Repeat the calculation for each new period to update the SMA.
Exponential Moving Average (EMA)

The Exponential Moving Average (EMA) is a type of moving average that gives more weight to recent price data points, making it more responsive to price changes compared to the Simple Moving Average (SMA).
When comparing EMA to SMA, the key difference lies in how each type of moving average calculates the average price. While SMA gives equal weight to all data points, EMA assigns more importance to recent price movements. This means that EMA reacts faster to price changes, making it more suitable for traders and analysts who want to capture short-term trends in the market.
Scenarios where EMA is more suitable than SMA
- EMA is preferred in fast-moving markets where quick responses to price changes are essential.
- Traders who focus on short-term trading strategies often use EMA to identify entry and exit points more effectively.
- EMA is valuable in identifying trend reversals earlier than SMA, allowing traders to capitalize on market shifts.
How EMA reacts faster to price changes compared to SMA
When calculating EMA, recent price data points are given more weight, resulting in a faster response to price fluctuations. The formula for EMA includes a smoothing factor that adjusts the weight of each data point based on the chosen time period. This makes EMA more sensitive to recent price movements, causing it to react quickly to changes in the market.
EMA = (Close – EMA(previous)) x multiplier + EMA(previous)
Crossover Strategy
:max_bytes(150000):strip_icc()/dotdash_Final_How_to_Use_a_Moving_Average_to_Buy_Stocks_Jun_2020-02-85609403fbee41089d13a9ffa649bdac.jpg?w=700 "Moving stocks investopedia jiang")
The crossover strategy using moving averages involves analyzing the relationship between two different moving averages to identify potential buy or sell signals in the market.
Traders commonly use two types of moving averages for this strategy: the Simple Moving Average (SMA) and the Exponential Moving Average (EMA). When the shorter-term moving average crosses above the longer-term moving average, it generates a bullish crossover signal, indicating a potential uptrend. Conversely, when the shorter-term moving average crosses below the longer-term moving average, it produces a bearish crossover signal, suggesting a possible downtrend.
Examples of Bullish and Bearish Crossover Signals
- In a bullish crossover signal, the 50-day SMA crosses above the 200-day SMA, indicating a potential uptrend in the market.
- Conversely, in a bearish crossover signal, the 50-day EMA crosses below the 100-day EMA, signaling a possible downtrend.
Traders use crossover signals to make buy or sell decisions by considering the direction of the crossover (bullish or bearish) and the strength of the signal. A strong crossover signal with a significant price movement may provide more confidence for traders to enter or exit positions in the market. Additionally, traders often use other technical indicators or tools to confirm crossover signals and avoid false signals that may result in losses.
Golden Cross and Death Cross

The Golden Cross and Death Cross are important technical patterns used in stock analysis to predict market trends based on the moving averages of stock prices. These crosses can signal potential buy or sell opportunities for traders and investors.
Golden Cross, Stock analysis using moving averages
The Golden Cross occurs when the short-term moving average, typically the 50-day Simple Moving Average (SMA), crosses above the long-term moving average, usually the 200-day SMA. This crossover is considered a bullish signal, indicating a potential uptrend in the stock price.
- It signifies a shift from a bearish to a bullish trend in the market.
- Traders may interpret this as a buying opportunity, expecting the stock price to continue rising.
- Historically, the Golden Cross has preceded significant market rallies, leading to strong upward movements in stock prices.
Death Cross
Conversely, the Death Cross occurs when the short-term moving average crosses below the long-term moving average. This crossover is considered a bearish signal, indicating a potential downtrend in the stock price.
- It signifies a shift from a bullish to a bearish trend in the market.
- Traders may interpret this as a selling opportunity, expecting the stock price to decline further.
- Historically, the Death Cross has preceded significant market downturns, leading to sharp declines in stock prices.
Ending Remarks
In conclusion, Stock analysis using moving averages opens up a realm of possibilities for traders and investors, empowering them to leverage data-driven insights for strategic decision-making in the ever-evolving financial landscape. Dive in, explore, and unlock the potential of moving averages in your stock analysis journey.
When it comes to stock investing, trend following strategies play a crucial role in determining success. By analyzing market trends and making decisions based on them, investors can capitalize on opportunities and minimize risks. Understanding trend following strategies in stock investing is essential for anyone looking to navigate the volatile world of stocks effectively.
When it comes to stock investing, trend following strategies play a crucial role in determining success. By analyzing market trends and making informed decisions, investors can capitalize on profitable opportunities. Understanding the ins and outs of trend following strategies in stock investing is essential for maximizing returns and minimizing risks in the ever-changing financial landscape.