Technical analysis for Forex trading introduces traders to essential tools and techniques for successful trading in the forex market. From chart patterns to indicators, this guide covers everything you need to know to make informed decisions.
As we delve into the intricacies of technical analysis, you’ll discover the key principles and strategies that can help you navigate the complexities of the forex market with confidence.
Introduction to Technical Analysis in Forex Trading
Technical analysis is a method used by forex traders to evaluate and forecast price movements based on historical market data. This analysis focuses on studying past market trends, price patterns, and trading volume to predict future price movements.
Importance of Technical Analysis for Traders
- Helps identify trends: Technical analysis helps traders identify trends in the forex market, allowing them to make informed decisions on when to buy or sell currencies.
- Provides entry and exit points: By analyzing charts and patterns, traders can determine optimal entry and exit points for their trades.
- Risk management: Technical analysis helps traders manage risk by setting stop-loss orders and determining potential profit targets.
Examples of Technical Analysis Tools Used in Forex Trading
- Moving Averages: Moving averages are used to smooth out price data and identify trends over a specific period of time.
- Relative Strength Index (RSI): RSI is a momentum oscillator that measures the speed and change of price movements, indicating overbought or oversold conditions.
- Bollinger Bands: Bollinger Bands are used to measure volatility and identify potential reversal points in the market.
Key Principles of Technical Analysis

Technical analysis in Forex trading is based on several key principles that help traders make informed decisions. By analyzing historical price data, identifying trends, and recognizing support and resistance levels, traders can anticipate future price movements and take advantage of profitable trading opportunities.
Historical Price Data Analysis
In technical analysis, historical price data is crucial for understanding how an asset has behaved in the past and predicting how it may perform in the future. Traders use price charts, patterns, and indicators to analyze historical data and identify potential trading opportunities. By studying price movements over time, traders can gain valuable insights into market trends and make more accurate predictions.
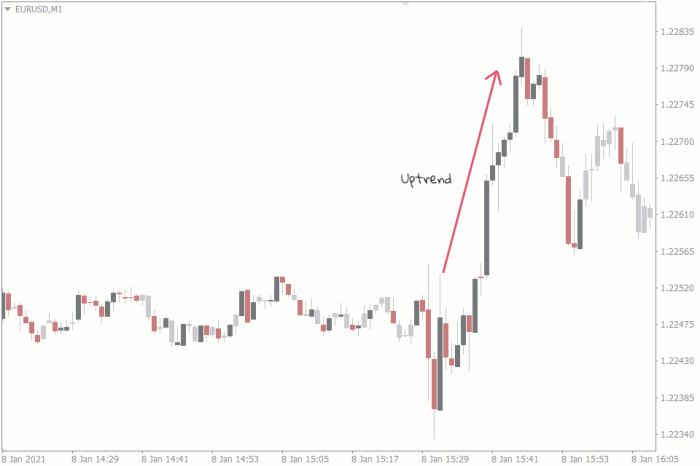
Trends in Technical Analysis
One of the fundamental principles of technical analysis is the concept of trends. Traders look for patterns in price movements that indicate whether an asset is trending upwards, downwards, or moving sideways. By identifying trends, traders can determine the general direction of the market and adjust their trading strategies accordingly. Trend analysis is essential for predicting future price movements and maximizing profits in Forex trading.
Support and Resistance Levels
Support and resistance levels are key components of technical analysis that help traders identify potential entry and exit points for their trades. Support levels represent price levels where an asset is expected to find buying interest, preventing it from falling further. Resistance levels, on the other hand, are price levels where selling pressure is expected to increase, preventing the asset from rising higher. By understanding support and resistance levels, traders can make more informed decisions and improve their overall trading success.
Common Chart Patterns in Forex Technical Analysis: Technical Analysis For Forex Trading
Chart patterns play a crucial role in forex technical analysis as they help traders identify potential market movements based on historical price data. By recognizing and interpreting these patterns, traders can make informed decisions to enter or exit trades.
Head and Shoulders Pattern, Technical analysis for Forex trading
The head and shoulders pattern is a reversal pattern that indicates a change in trend. It consists of three peaks: a higher peak (head) between two lower peaks (shoulders). When the price breaks below the neckline connecting the lows of the two shoulders, it signals a potential downtrend.
Double Tops and Bottoms
Double tops and bottoms are reversal patterns that occur after a significant price movement. A double top is formed when the price reaches a peak twice but fails to break higher, indicating a potential trend reversal to the downside. Conversely, a double bottom occurs when the price reaches a low twice but fails to break lower, signaling a potential trend reversal to the upside.
When it comes to forex trading, understanding the difference between major and minor currency pairs is crucial. Major currency pairs involve the most traded currencies in the world, such as the US dollar, Euro, and Japanese Yen, while minor currency pairs consist of less popular currencies like the Swiss Franc or the Swedish Krona.
To learn more about the distinctions and their impact on trading, check out this comprehensive guide on Major vs minor currency pairs.
Triangles
Triangles are continuation patterns that indicate a period of consolidation before the price breaks out in the direction of the previous trend. There are different types of triangles, such as symmetrical, ascending, and descending triangles, each with its own implications for potential market movements.
When it comes to forex trading, understanding the difference between major and minor currency pairs is crucial. Major pairs involve the most traded currencies globally, such as the US dollar, euro, and Japanese yen. On the other hand, minor pairs consist of less liquid currencies, offering different trading opportunities.
To learn more about the distinctions between major and minor currency pairs, check out this informative article on Major vs minor currency pairs.
Flags and Pennants
Flags and pennants are short-term continuation patterns that occur after a strong price movement. Flags are characterized by a rectangular-shaped pattern, while pennants are more triangular in shape. Both patterns signal a brief pause in the trend before a potential continuation in the same direction.
How to Use Chart Patterns for Trading
Traders can use chart patterns by combining them with other technical indicators to confirm signals and make well-informed trading decisions. It is essential to wait for confirmation, such as a breakout or a change in volume, before entering a trade based on a chart pattern.
Technical Indicators and Oscillators

In forex trading, technical indicators and oscillators play a crucial role in analyzing price movements and making informed trading decisions. These tools help traders identify trends, momentum, and potential reversal points in the market.
Popular Technical Indicators and Oscillators
- Relative Strength Index (RSI): RSI is a momentum oscillator that measures the speed and change of price movements. It is used to identify overbought or oversold conditions in the market.
- Moving Average Convergence Divergence (MACD): MACD is a trend-following momentum indicator that shows the relationship between two moving averages of a security’s price. Traders use it to identify trend direction and potential buy or sell signals.
- Moving Averages: Moving averages are popular indicators that smooth out price data to identify trends over a specific period. Traders use different types of moving averages (such as simple moving average or exponential moving average) to confirm trends and potential entry or exit points.
How Indicators Help Traders
- Identifying Trends: Indicators like moving averages help traders identify the direction of the trend, whether it is bullish, bearish, or ranging.
- Spotting Reversal Points: Oscillators like RSI help traders identify potential reversal points when a market is overbought or oversold.
- Confirming Signals: Indicators like MACD help confirm trading signals generated by other tools, increasing the probability of successful trades.
Comparing Different Types of Indicators
| Indicator | Application |
|---|---|
| RSI | Identifying overbought or oversold conditions |
| MACD | Confirming trend direction and potential entry/exit points |
| Moving Averages | Confirming trends and identifying support/resistance levels |
Drawing Tools and Fibonacci Retracement

When it comes to technical analysis in Forex trading, drawing tools such as trendlines, channels, and Fibonacci retracement are essential for identifying potential entry and exit points. These tools help traders visualize price movements and patterns, enabling them to make informed decisions based on historical data and market trends.
Trendlines
- Trendlines are used to connect the highs or lows of an asset’s price movements, allowing traders to identify the direction of the trend.
- Upward trendlines connect higher lows and signal an upward trend, while downward trendlines connect lower highs and indicate a downward trend.
- Traders can use trendlines to determine potential entry points when the price retraces to the trendline and exits when the trendline is broken.
Channels
- Channels are created by drawing parallel lines along the highs and lows of an asset’s price movements, defining a range within which the price fluctuates.
- Traders can use channels to identify potential support and resistance levels, as well as to determine breakout or reversal points.
- Trading within the channel can provide opportunities to buy at support levels and sell at resistance levels.
Fibonacci Retracement
- Fibonacci retracement levels are based on the mathematical sequence discovered by Leonardo Fibonacci and are used to identify potential support and resistance levels in a market.
- Traders use Fibonacci retracement levels to determine potential price reversals or continuation points based on the historical price movements of an asset.
- Common Fibonacci retracement levels include 23.6%, 38.2%, 50%, 61.8%, and 100%, which are considered key levels where price reversals may occur.
Outcome Summary
In conclusion, mastering technical analysis is crucial for anyone looking to thrive in the world of forex trading. By understanding chart patterns, indicators, and drawing tools, you can enhance your trading skills and make more informed decisions. Start applying these techniques to your trading strategy today and watch your success soar in the forex market.